Cassandra for Real-Time Storage in Energy Analytics
Published on August 28, 2019

Amruta Patil
Associate Big Data Specialist at Sustlabs
Introduction:
It is amazing to see the volume of free information available on the internet. And, all of that comes with no physical, admission or relationship-based constraints. The only cost is curation. That's the task of curation we had in our hands at our energy-analytics start-up SustLabs with its retail product OHM.
Imagine this, each one of our devices transmits data to us every 4-10 s. As the business acquires more consumers, we expect to have thousands of these devices deployed at our customers. As you can envisage, this exerts an intensive demand on our storage, which, in turn, motivated us to deploy big databases for our analytics. So, when we started exploring options for our data storage, we evaluated HBase, Mongo DB, Cassandra, etc., For now, Cassandra came out as the winner for our storage needs. Rapid writes and lightning-fast reads were the main reasons in favor of Cassandra. Additionally, Cassandra has many more features such as extreme resilience, fault tolerance and the ability to solve complicated tasks with ease.
Setup of Database:
Cassandra stores raw incoming data streams at every 4-10 s. This data is used to analyze the energy consumed by the customer on a daily, monthly and yearly basis. Data within Cassandra is read every hour and aggregated with the help of Spark and Nodejs. This aggregated data is then shown on our smartphone application OHM for users to understand their energy consumption patterns in a simple language and format.
As the size of data started increasing from MBs to GBs, we decided to increase the number of nodes in our Cassandra cluster. Datadog is a very useful tool for monitoring a cluster of Cassandra nodes. It helps us track the activities such as node status which tells us which node is up and which node is down, the data size of each node, including reading and write latency in percentile and the count too, CPU usage and network usage. It shows the max partition size, max row size per table and many more. In short, you can say it shows all the processes going on all the nodes which also helps to reduce the workload as we can find out the exact point of failure if any. The following images show the read request counts, disk writes count and the network traffic we face.

The above graph shows you the read request counts per second which comes to the cluster from the client.

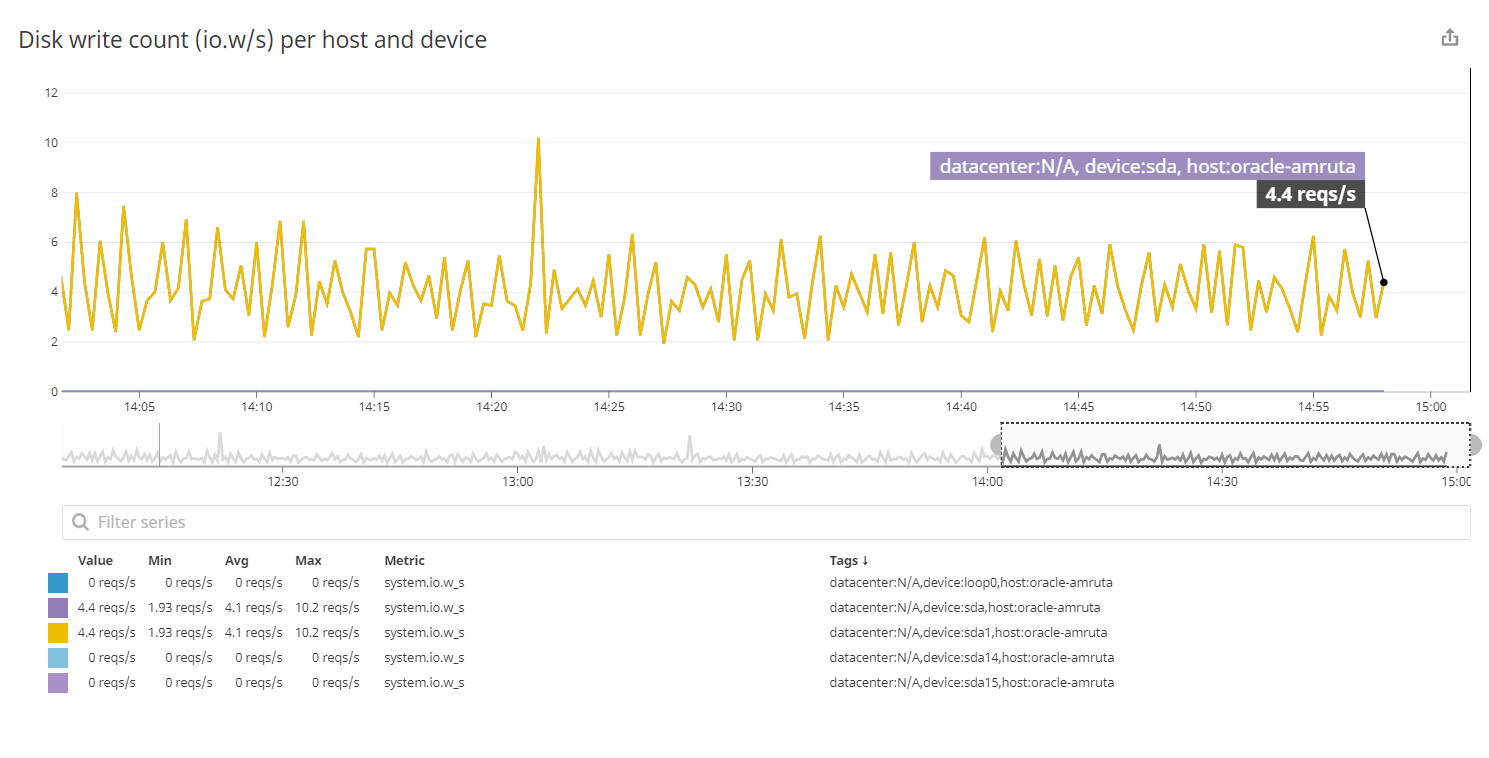
The above graph is to show the write request issued from the devices per second.

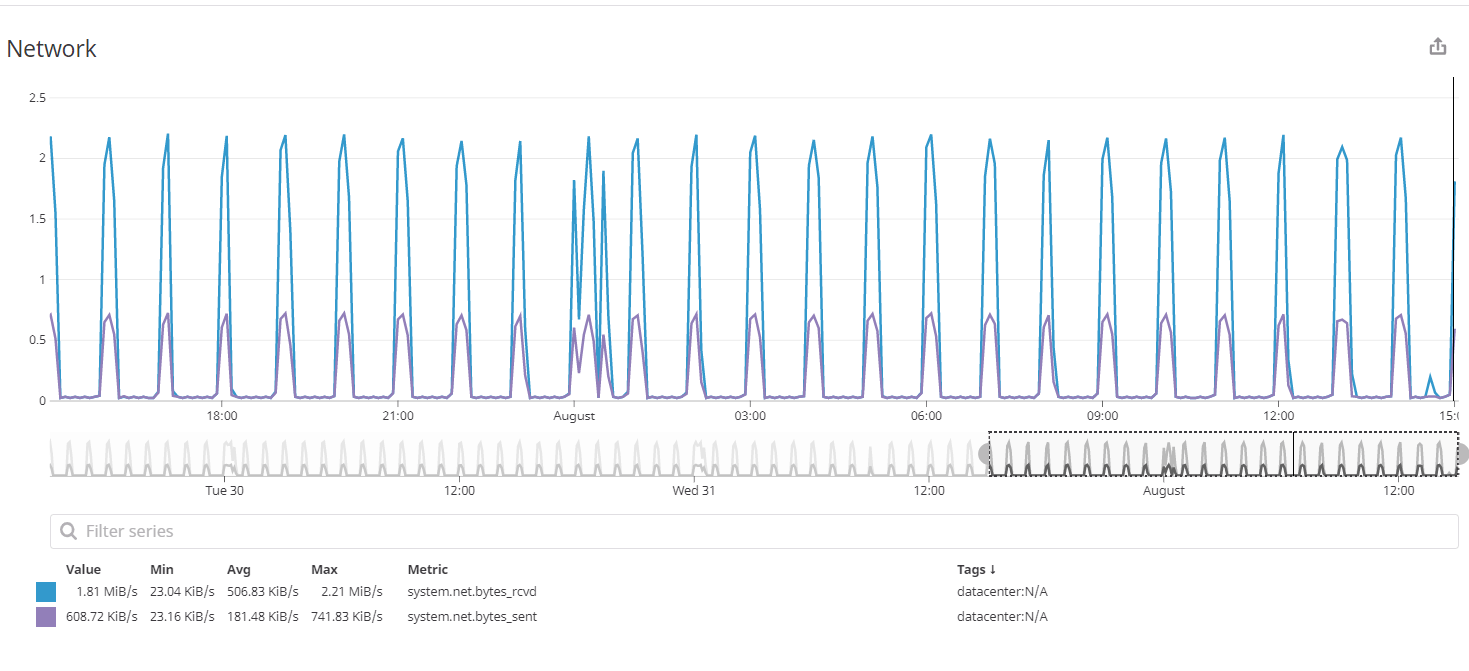
The above graph represents the number of bytes received on a device per second which is represented in blue line and the number of bytes sent from a device per second which is represented in purple line.
Challenges that we faced.
Setting up the database was a big challenge. The initial experiments were conducted on Mongodb before exploring Cassandra. As we had to implement sharding at a very early stage, so we started experimenting with Cassandra and it worked as per our needs. So, now Cassandra writes the data in 2-10 ms. As mentioned earlier, the next challenge was that of scaling as we started deploying more and more devices resulting in huge data. So, we added 3 more nodes to check how it distributes the data across all the nodes which slowly gave us confidence as it fulfilled the initial needs that we set out to experiment with.
With all these experiments Sustlabs is on the verge of improving analytical accuracy which will help OHM to shine brightly.